The 15-minutes city and to what residents care about (7/7)

To what extent does the 15-minute city match the ideal images of residents, many of whom are used to using the car?

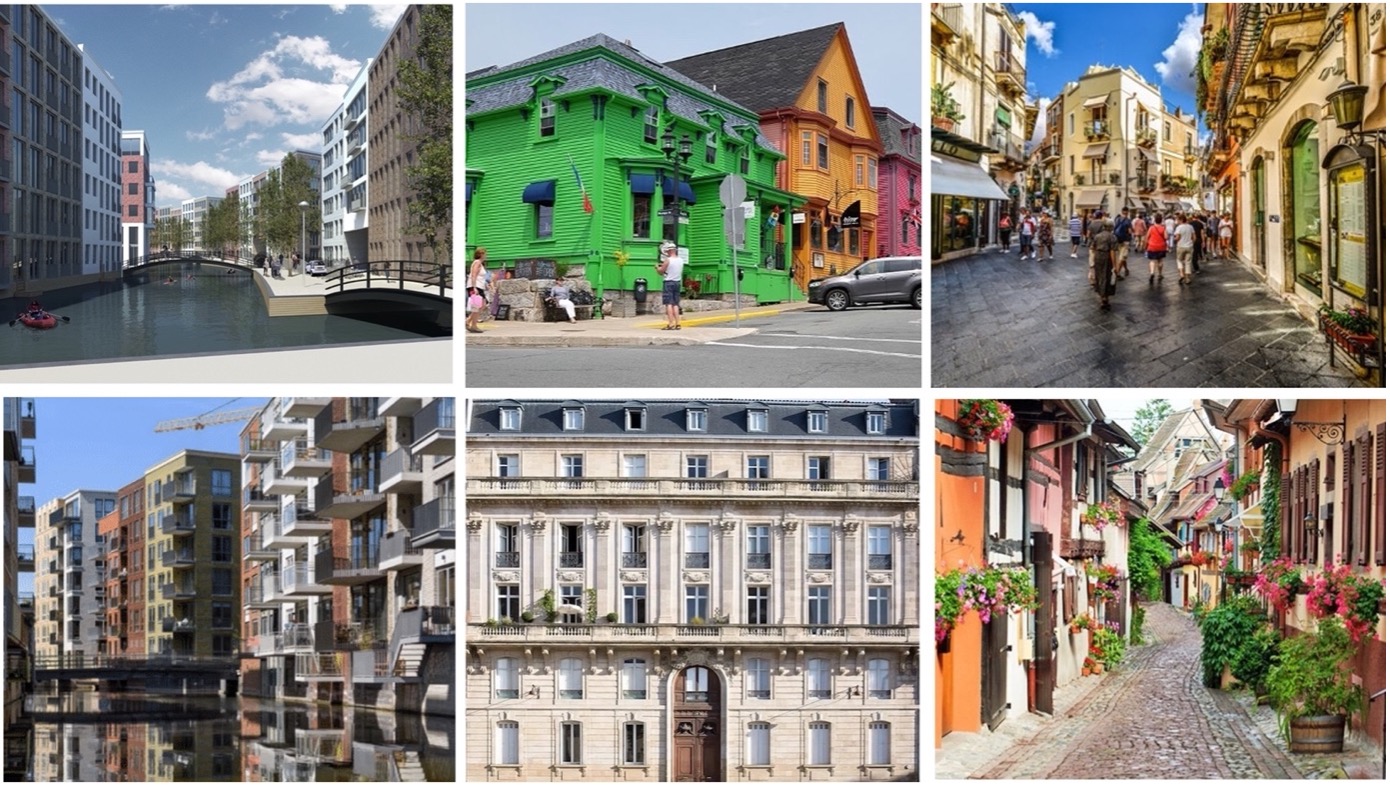
For decades, the behaviour of urban planners and politicians, but also of residents, has been determined by images of the ideal living environment, especially for those who can afford it. The single-family home, a private garden and the car in front of the door were more prominent parts of those images than living in an inclusive and complete neighbourhood. Nevertheless, such a neighbourhood, including a ‘house from the 30s’, is still sought after. Attempts to revive the idea of ‘trese ‘traditional’ neighbourhoods’ have been made in several places in the Netherlands by architects inspired by the principles of ‘new urbanism’ (see photo collage above). In these neighbourhoods, adding a variety of functions was and is one of the starting points. But whether residents of such a neighbourhood will indeed behave more ‘locally’ and leave their cars at home more often does not depend on a planning concept, but on long-term behavioural change. 

An important question is what changes in the living environment residents themselves prefer. Principles for the (re)design of space that are in line with this have the greatest chance of being put into practice. It would be good to take stock of these preferences, confront (future) residents conflicting ideas en preconditions, for instance with regard to the necessary density. Below is a number of options, in line with commonly expressed preferences.

1. Playing space for children

Especially parents with children want more playing space for their children. For the youngest children directly near the house, for older children on larger playgrounds. A desire that is in easy reach in new neighbourhoods, but more difficult in older ones that are already full of cars. Some parents have long been happy with the possibility of occasionally turning a street into a play street. A careful inventory often reveals the existence of surprisingly many unused spaces. Furthermore, some widening of the pavements is almost always necessary, even if it costs parking space.

2. Safety

High on the agenda of many parents are pedestrian and cycle paths that cross car routes unevenly. Such connections substantially widen children’s radius. In existing neighbourhoods, this too remains daydreaming.  What can be done here is to reduce the speed of traffic, ban through traffic and make cars ‘guests’ in the remaining streets. 

3. Green

A green-blue infrastructure, penetrating deep into the immediate surroundings is not only desired by almost everyone, but also has many health benefits. The presence of (safe) water buffering (wadis and overflow ponds) extends children’s play opportunities, but does take up space. In old housing estates, not much more is possible in this area than façade gardens on (widened) pavements and vegetation against walls.

4. Limiting space for cars

Even in older neighbourhoods, opportunities to play safely and to create more green space are increased by closing (parts of) streets to cars. A pain point for some residents. One option for this is to make the middle part of a street car-free and design it as an attractive green residential area with play opportunities for children of different age groups. In new housing estates, much more is possible and it hurts to see how conventionally and car-centred these are often still laid out. (Paid) parking at the edge of the neighbourhood helps create a level playing field for car and public transport use.

5. Public space and (shopping) facilities

Sometimes it is possible to turn an intersection, where for instance a café or one or more shops are already located, into a cosy little square. Neighbourhood shops tend to struggle. Many people are used to taking the car to a supermarket once a week to stock up on daily necessities for the whole week. However, some neighbourhoods are big enough for a supermarket. In some cities, where car ownership is no longer taken for granted, a viable range of shops can develop in such a square and along adjacent streets. Greater density also contributes to this.

6. Mix of people and functions

A diverse range of housing types and forms is appreciated. Mixing residential and commercial properties can also contribute to the liveliness of a neighbourhood. For new housing estates, this is increasingly becoming a starting point. For business properties, accessibility remains an important precondition. 

7. Public transport

The desirability of good public transport is widely supported, but in practice many people still often choose the car, even if there are good connections. Good public transport benefits from the ease and speed with which other parts of the city can be reached. This usually requires more than one line. Free bus and tram lanes are an absolute prerequisite. In the (distant) future, autonomous shuttles could significantly lower the threshold for using public transport. Company car plus free petrol is the worst way to encourage sensible car use.

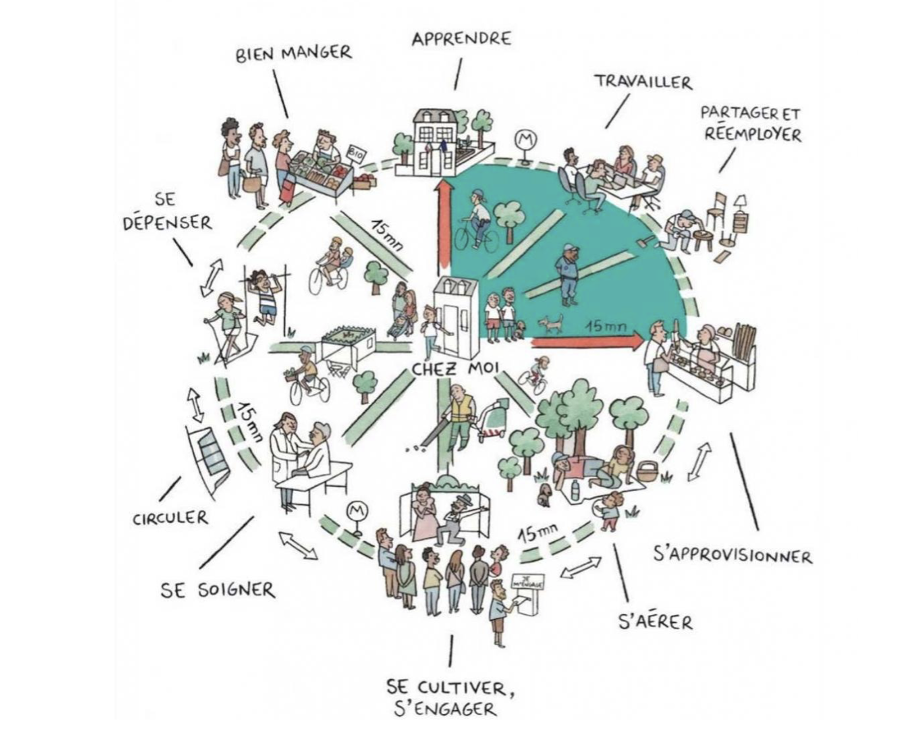
8. Centres in plural

The presence of a city centre is less important for a medium-sized city, say the size of a 15-minute cycle zone, than the presence of a few smaller centres, each with its own charm, close to where people live. These can be neighbourhood (shopping) centres, where you are sure to meet acquaintances.  Some of these will also attract residents from other neighbourhoods, who walk or cycle to enjoy the wider range of amenities. The presence of attractive alternatives to the ‘traditional’ city centre will greatly reduce the need to travel long distances.

The above measures are not a roadmap for the development of a 15-minute city; rather, they are conditions for the growth of a liveable city in general.  In practice, its characteristics certainly correspond to what proponents envisage with a 15-minute city. The man behind the transformation of Paris into a 15-minute city, Carlos Moreno, has formulated a series of pointers based on all the practical examples to date, which can help citizens and administrators realise the merits of the 15-minute city in their own environments. This book will be available from mid-June 2024 and can be reserved HERE.

How do higher density and better quality of life go together? 3/7

A certain degree of compactness is essential for the viability of 15-minute cities.  This is due to the need for an economic threshold for facilities accessible by walking or cycling. A summary of 300 research projects by the OECD shows that compactness increases the efficiency of public services in all respects. But it also reveals disadvantages in terms of health and well-being due to pollution, traffic, and noise. The assumption is that there is an optimal density at which both pleasant living and the presence of everyday facilities – including schools – can be realised.  At this point, ‘densification’ is not at the expense of quality of life but contributes to it.  A lower density results in more car use and a higher density will reduce living and green space and the opportunity to create jobs.

The image above is a sketch of the ‘Plan Papenvest’ in Brussels. The density, 300 dwellings on an area of 1.13 hectares, is ten times that of an average neighbourhood. Urban planners often mention that the density of Dutch cities is much lower than in Paris and Barcelona, for example. Yet it is precisely in these cities that traffic is one of the main causes of air pollution, stress, and health problems. The benefits of compactness combined with a high quality of life can only be realised if the nuisances associated with increasing density are limited. This uncompromisingly means limiting car ownership and use.

Urban planners often seem to argue the other way round. They argue that building in the green areas around cities must be prevented at all costs to protect nature and that there is still enough space for building in the cities. The validity of this view is limited. In the first place, the scarce open space within cities can be better used for clean workshops and nature development in combination with water control. Secondly, much of the ‘green’ space outside cities is not valuable nature at all. Most of it is used to produce feed for livestock, especially cows. Using a few per cent of this space for housing does not harm nature at all. This housing must be concentrated near public transport. The worst idea is to add a road to the outskirts of every town and village. This will undoubtedly increase the use of cars.

HERE you can link to my free downloadable e-book: 25 Building blocks to create better streets, neighborhoods and cities 

The 15-minute city: from metaphor to planning concept (2/7)

Carlos Moreno, a professor at the Sorbonne University, helped Mayor Anne Hidalgo develop the idea of the 15-minute city. He said that six things made people happy: living, working, amenities, education, wellbeing, and recreation. The quality of the urban environment is enhanced when these functions are realized near each other. The monofunctional expansion of cities in the US, but also in the bidonvilles of Paris, is a thorn in his side, partly because this justifies owning a car.

A more precise definition of the concept of the 15-minute city is needed before it can be implemented on a large scale. It is important to clarify which means of transport must be available to reach certain facilities in a given number of minutes. The list of facilities is usually very comprehensive, while the list of means of transport is usually only vaguely defined. But the distance you can travel in 15 minutes depends on the availability of certain modes of transport (see figure above).

Advocates of “new urbanism” have developed the tools to design 15-minute cities. They are based on three zones: the 5-minute walking zone, the 15-minute walking zone, which coincides with the 5-minute cycling zone, and finally the 15-minute cycling zone. These are not static concepts: In practice, the zones overlap and complement each other.

The 5-minute walking zone

This zone corresponds to the way in which most residential neighbourhoods functioned up until the 1960s, wherever you are in the world. Imagine a space with an average distance from the center to the edge of about 400 meters. In the center you will find a limited number of shops, a (small) supermarket, one or more cafes and a restaurant. The number of residents will vary between two and three thousand. Density will decrease from the centre and the main streets outwards. Green spaces, including a small neighbourhood park, will be distributed throughout the neighbourhood, as will workshops and offices.

In the case of new construction, it is essential that pedestrian areas have a dense network of paths without crossings at ground level with streets where car traffic is allowed. Some paths are wider and allow cycling within the 5- and 15-minute cycle zones. The streets provide access to concentrated parking facilities.

The 5-minute cycle zone and the 15-minute walking zone.

Here the distance from the center to the edge is about one kilometer. In this area, most of the facilities that residents need is available and can be distributed around the centers of the 5-minute walking zones. For example, a slightly larger supermarket may be located between two 5-minute walking zones. This zone will also contain one or more larger parks and some larger concentrations of employment.

This zone can be a large district of a city, but it can also be a small municipality or district of around 15 to 25,000 inhabitants. With such a population there will be little room for dogmatic design, especially when it comes to existing buildings. But even then, it is possible to separate traffic types by keeping cars off many streets and clustering car parks. The bottom line is that all destinations in this zone can be reached quickly by walking and cycling, and that car routes can be crossed safely.

The car will be used (occasionally) for several destinations. For example, for large shopping trips to the supermarket.

The 15-minute cycle zone.

This zone will be home to 100.00 or more residents. The large variation is due to the (accidental) presence of facilities for a larger catchment area, such as an industrial estate, a furniture boulevard or an IKEA, a university or a (regional) hospital. It is certainly not a sum of comparable 5-minute cycle zones. Nevertheless, the aim is to distribute functions over the whole area on as small a scale as possible. In practice, this zone is also crossed by several roads for car traffic. The network of cycle paths provides the most direct links between the 5-minute cycle zones and the wider area.

The main urban development objectives for this zone are good accessibility to urban facilities by public transport from all neighbourhoods, the prohibition of hypermarkets and a certain distribution of central functions throughout the area: Residents should be able to go out and have fun in a few places and not just in a central part of the city.

Below you can link to my free downloadable e-book: 25 Building blocks to create better streets, neighborhoods and cities

The 15-minute city: from vague memory to future reality (1/7)

Paris: La Ville du Quart d’Heure

Without changes to the transport system in which they operate, the advent of autonomous cars will not significantly improve the quality of life in our cities. This has been discussed in previous contributions. This change includes prioritizing investment in developing high-quality public transport and autonomous minibuses to cover the first and last mile.

However, this is not enough by itself. The need to reduce the distances we travel daily also applies to transporting raw materials and food around the world. This is the subject of a new series of blog posts, and probably the last.

Over the next few weeks I will be discussing the sustainability of the need for people and goods to travel long distances. In many cities, the corona pandemic has been a boost to this idea. Paris is used as an example. But what applies to Paris applies to every city.

When Anne Hidalgo took office as the newly elected mayor in 2016, her first actions were to close the motorway over the Seine quay and build kilometres of cycle paths. Initially, these actions were motivated by environmental concerns. Apparently, there was enough support for these plans to ensure her re-election in 2020. She had understood that measures to limit car traffic would not be enough. That is why she campaigned on the idea of “La Ville du Quart d’Heure”, the 15-minute city, also known as the “complete neighbourhood”. In essence, the idea is to provide citizens with almost all of their daily needs – employment, housing, amenities, schools, care and recreation – within a 15-minute walk or bike ride of their homes. The idea appealed. The idea of keeping people in their cars was replaced by the more sympathetic, empirical idea of making them redundant.

During pandemics, lockdowns prevent people from leaving their homes or travelling more than one kilometer. For the daily journey to work or school, the tele-works took their place, and the number of (temporary) “pistes á cycler” quickly increased. For many Parisians, the rediscovery of their own neighbourhood was a revelation. They looked up to the parks every day, the neighbourhood shops had more customers, commuters suddenly had much more time and, despite all the worries, the pandemic was in a revival of “village” coziness.

A revival, indeed, because until the 1960s, most of the inhabitants of the countries of Europe, the United States, Canada and Australia did not know that everything they needed on a daily basis was available within walking or cycling distance. It was against this backdrop that the idea of the 15-minute city gained ground in Paris.

We talk about a 15-minute city when neighbourhoods have the following characteristics

– a mix of housing for people of different ages and backgrounds – pedestrians and cyclists

– Pedestrians and cyclists, especially children, can safely use car-free streets.

– Shops within walking distance (up to 400 meters) for all daily needs

– The same goes for a medical center and a primary school.

– There are excellent public transport links;

– Parking is available on the outskirts of the neighbourhood.

– Several businesses and workshops are located in each neighbourhood.

– Neighbourhoods offer different types of meeting places, from parks to cafes and restaurants.

– There are many green and leafy streets in a neighbourhood.

– The population is large enough to support these facilities.

– Citizens have a degree of self-management.

Urban planners have rarely lost sight of these ideas. In many cities, the pandemic has made these vague memories accessible goals, even if they are far from reality.

In the next post, I will reflect on how the idea of the 15-minute city is moving from dream to reality.

HERE you can link to my free downloadable e-book: 25 Building blocks to create better streets, neighborhoods and cities

When will robotaxi’s become commonplace? (8/8)

Autonomous shuttle bus in tourist hotspot Terhills (Genk, Belgium)

Until recently, optimists would say “in a few years.” Nobody believes that anymore, except for Egon Musk. The number of – so far small – incidents involving robot taxis is increasing to such an extent that the cities where these taxis operate on a modest scale, San Francisco in particular, want to take action.

Europe vs USA

In any case, it will take a long time before robotaxis are commonplace in Europe. There are two major differences between the US and Europe when it comes to transportation policy.

In the US, each state can individually determine when autonomous vehicles can hit the road. In Europe, on the other hand, a General Safety Regulation has been in force since June 2022 that applies to all countries. This states, among other things, that a driver must maintain control of the vehicle at all times. Strict conditions apply to vehicles without a driver: separate lanes, short routes on traffic-calmed parts of the public road and always with a ‘safety driver’ on board.

The second difference is that in the US 45% of all residents do not have public transport available. In Europe you can get almost anywhere by public transport, although the frequency is low in remote areas. Governments say they want to further increase accessibility by public transport, even if this is at the expense of car traffic. To this end, they want an integrated transport policy, a word that is virtually unknown in the US.

Integrated transport policy

In essence, integrated transport policy is the offering of a series of transport options that together result in (1) the most efficient, safe and convenient satisfaction of transport needs, (2) reduction of the need to travel over long distances (including via the ’15- minutes city’) and (3)  minimal adverse effects on the environment and the quality of life, especially in the large cities. In other words, transport is part of policy aimed at improving the quality of the living environment.

Integrated transport policy assesses the role of vehicle automation in terms of their contribution to these objectives. A distinction can be made between the automation of passenger cars (SAE level 1-3) and driverless vehicles (SEA level 4-5).

Automation of passenger cars

Systems such as automatic lane changes, monitoring distance and speed, and monitoring the behavior of other road users are seen as contributing to road safety. However, the driver always remains responsible and must therefore be able to take over steering at any time, even if the car does not emit a (disengagement) signal. Eyes on the road and hands on the wheel.

Driverless cars

‘Hail-riding’ will result in growth of traffic in cities because the number of car kilometers per user increases significantly, at the expense of walking, cycling, public transport and to a much lesser extent the use of private cars. Sofar, the number of people who switch from their own car to ‘hail-riding’ is minimal. The only way to reverse this trend is to impose heavy taxes on car kilometers in urban areas. On the other hand, the use of robot shuttles is beneficial in low-traffic areas and on routes from residential areas to a station. Shuttles are also an excellent way to reduce car use locally. For example, in the extensive Terhills resort in Genk, Belgium, where people leave their cars in the parking lot and transfer to autonomous shuttles that connect the various destinations on the site with high frequency.

A few months ago (April 2023), I read that Qbus in the Netherlands wants to experiment with 18-meter-long autonomous buses, for the time being accompanied by a ‘safety driver’. Routes on bus lanes outside the busiest parts of the city are being considered. Autonomous metros and trains have been running in various cities, including London, for years. It is this incremental approach that we will need in the coming years instead of dreaming about getting into an autonomous car, where a made bed awaits us and we wakes us rested 1000 kilometers away. Instead of overcrowded roads with moving beds, we are better off with a comfortable and well-functioning European network of fast (sleeper) trains on a more modern rail infrastructure and efficient and convenient pre- and post-transport.

Automated cars; an uncertain future (7/8)

For more than a decade, car manufacturers have been working on technology to take over driver’s actions. A Lot  of money has been invested in this short period and many optimistic expectations have been raised, but no large-scale implementation of the higher SAE levels resulted so far. Commercial services with robotaxi’s are scarce and still experimental.

Misleading photo: This is not allowed in any country, unless the car is parked

The changing tide

Especially in the period 2015 – 2018, the CEOs of the companies involved cheered about the prospects; soon after, sentiment changed. In November 2018, Waymo CEO John Krafcik said that the spread of autonomous cars is still decades away and that driving under poor circumstances and in overcrowded cities will always require a human driver. Volkswagen’s CEO said fully self-driving cars “may never” hit public roads.

The companies involved are therefore increasingly concerned about the return on the $100 billion invested in the development of car automation until the end of 2021. The end of the development process is not yet in sight. Much has been achieved, but the last 20% of the journey to the fully autonomous car will require the most effort and much more investment. Current technology is difficult to perfect. “Creating self-driving robotaxi is harder than putting a man on the moon,” said Jim Farley, CEO of Ford, after terminating Argo, the joint venture with Volkswagen, after the company had invested $100 million in it.

The human brain can assess complex situations on the road much better than any machine. Artificial intelligence is much faster, but its accuracy and adaptability still leave much to be desired. Driverless cars struggle with unpredictability caused by children, pedestrians, cyclists, and other human-driven cars as well as with potholes, detours, worn markings, snow, rain, fog, darkness and so on. This is also the opinion of Gabriel Seiberth, CEO of the German computer company Accenture, and he advises the automotive industry to focus on what is possible. Carlo van de Weijer, director of Artificial Intelligence at TU Eindhoven, agrees: “There will not be a car that completely takes over all our tasks.”

Elon Musk, on the other hand, predicted that by 2020 all Tesla’s will have SEA level 5 thanks to the new Full Self Driving Chip. In 2023 we know that its performance is indeed impressive. Tesla may therefore be the first car to be accredited at SAE level 3. That is not yet SAE level 5. The question is whether Elon Musk minds that much!

The priorities of the automotive industry

For established automotive companies, the priority is to sell as many cars as possible and not to make a driver redundant. The main objective is therefore to achieve SAE levels 2 and possibly 3. The built-in functions such as automatic lane changing, keeping distance, and passing will contribute to the safe use of cars, if drivers learn to use them properly. Research shows that drivers are willing to pay an average of around $2,500 for these amenities. That is different from the $15,000 that the beta version of Tesla’s Full Self Driving system costs.

The automotive industry is in a phase of adjusting expectations, temporizing investments, downsizing involved business units, and looking for partnerships. GM and Honda are collaborating on battery development; BMW, Volkswagen and Daimler are in talks to share R&D efforts for autonomous vehicles; and Ford and VW have stopped developing an autonomous car and are working together on more realistic ambitions.

Safety issues at SAE level 3

But even with a focus on SAE level 3, the problems do not go away. The biggest safety problem may well lie at this level. Elon Musk has suggested for years that Tesla’s autopilot would allow drivers to read a book or watch a movie. All they must do is stay behind the wheel. They must be able to take control of the car if the automatic system indicates that it can no longer handle the situation. Studies in test environments show that in this case the reaction time of drivers is far too long to prevent disaster. An eye on the road and a hand on the wheel is still mandatory everywhere in the world, except in  few paces for cars accredited at SEA level 4 under specified conditions.

The assumption is that the operating system is so accurate that it indicates in time that it considers the situation too complex. But there are still many doubts as to whether these systems themselves are sufficiently capable of properly assessing the situation on the road at all times. Recent research from King’s College London showed that pedestrian detection systems are 20% more accurate when dealing with white adults than when dealing with children and 7.5% more accurate when dealing with white people compared to people with dark skin.

In the next post I will go into more detail about the legislation and what the future may bring.

3. Attractive streetscape

This article is part of the series 25 building blocks to create better streets, neighbourhoods, and cities. Read how design, starting from the physical aspects of the streetscape and -pattern contributes to the quality of the urban environment. 

Streets and squares are appreciated best if there is cohesion between several elements, such as the block height, the number of floors, the type of houses, the building line and the colour. When some elements work together, others can vary. Uniformity without variation results in people avoiding a street.

Coherence and variation in balance

Variation creates liveliness and will extend the time visitors spend on a street. This principle is applied almost everywhere in the world. Walls are fitted with arches, pillars, porches, porches, pitched roofs, windowsills, canopies, balustrades, cornices, dormer windows, linear and vertical elements, see the bottom-centre image of a Paris’ building. At the same time, the attributes of separate buildings that provide variety are most effective against a coherent background. The Parisian avenues illustrate this too, because most edifices are built according to the same principles while the ornamentation of each facade differs. The attractive streetscape in Sicily (top right) and in the Alsace (bottom right) demonstrate an almost perfect balance between similarity and difference.

Use of colour

A good example are the painted houses in the Canadian settlement of Lunenburg, which was founded in the 18th century by German woodworkers and is a UNESCO world heritage site today (top centre). The nature of the construction and the type of buildings ensure cohesion; the colour provides the variation.

Street pattern

A manageable pattern of similarly important streets contributes to the spread of visitors and provides a level playing field for shops and restaurants. A mesh, which does not necessarily have to be rectangular, facilitates orientation. A rectangular street pattern is at the expense of the element of surprise and detracts from the feeling that there is something to discover. Squares will often be found at street intersections.

Landmarks

Understanding of the pattern of the streets is reinforced by providing intersections with landmarks, such as statues, fountains, or distinguishing buildings (photo, top right). These elements help visitors developing a mental map. Maps every here and there are more helpful than signposts. The fewer poles in the ground, the better.

Canals and moats

Canals and moats also contribute to the attractivity of the streetscape. They restore the human dimension in too wide streets, also in new parts of the city. The images on the left show a central street in Zaandam (top) and a ‘waterway’ in the Amsterdam Houthavens quarter (bottom). The edges of waterways should never be used as parking spaces. Definitely not in Amsterdam, because its unique streetscape.

Follow this link to find an overview of all articles.

Urban design for complexity 

Throughout history, cities have faced many problems: War and violence, disease, disasters, housing, utilities, traffic, crime, inequality, poverty, and greed. Moreover, the pace of population growth in cities is frightening. Every day, urban population increases by almost 150,000 – mostly poor – people, due to migration or births. Between to date and 2050, the world’s urban population is projected to rise from 3.6 billion to 6.3 billion residents.

The litany of problems affects all cities in the world, but not in the same degree. To cope with these problems, each city must make a diagnose of its own challenges and define solutions. 

City-life is complex and most afore-mentioned problems are related and often at odds, think about struggling poverty and reversing global heating. Therefore, these problems cannot be solved in separated silos. This is the reason reason that I reject reductionist approaches like ‘smart city’, ‘sharing city’, ‘circular city’ and the like. 

Instead, framing the challenges that cities face must start from the complexity of the city as such and the interrelations of people causing these problems. In this respect, I found the concept of a doughnut economy particularly helpful. It is elaborated by the British economist Kate Raworth in a report entitled A Safe and Just Space for Humanity. The report takes the simultaneous application of social and environmental sustainability as the point of department for humane behavior.

In essence, Raworth says that people have a great deal of freedom in the choice of activities in their city, if they stay within two types of boundaries:

The first limit is set by ecosystems; which make life on earth possible. However, we can also frustrate their operation, which has a direct impact on our living conditions. 

Something similar applies to society. Here you can also distinguish several aspects and each of them has a level that people should not fall below, the second limit. If this does happen, it will jeopardize the survival of society.

If you look at a donut, you will see a small circle in the center and a large circle on the outside. The small circle represents the social foundation, the lower limit of the quality of society. The large circle refers to the ecological ceiling. Between the two circles lies the space within which people can act as they please. Kate Raworth calls this space a safe and just space for humanity.

On the way to a city for humanity , what we need to do is, first of all, to define human actions that comply with or are threatening the ecological ceiling and social foundation of our own city. What follows is the formulation of targets to correct and subsequently enforce all actual violations of ecological and social boundaries. This applies to the city itself and the global effects of its activities.

As an exercise, I created a table of principles for 10 clusters of activities to address the challenges that many cities in developed countries share, combined with one target for each principle. You may want to download this table here.

I recommend this procedure to any city that intends to develop an integral vision starting from the complexity of city life and the interdependency of its activities. Amsterdam went through this process, together with Kate Raworth. The Amsterdam city donut is worth exploring closely.

This post based on by the new e-book Better cities, the contribution of digital technology.  Interested? Download the book here for free (90 pages)

Content:

Hardcore: Technology-centered approaches

1. Ten years of smart city technology marketing

2. Scare off the monster behind the curtain: Big Tech’s monopoly

Towards a humancentric approach

3. A smart city, this is how you do it

4. Digital social innovation: For the social good

Misunderstanding the use of data

5. Digital twins

6. Artificial intelligence

Embedding digitization in urban policy

7. The steps to urban governance

8. Guidelines for a responsible digitization policy

9. A closer look at the digitization agenda of Amsterdam

10. Forging beneficial cooperation with technology companies

Applications

11. Government: How digital tools help residents regaining power?

12. Mobility: Will MaaS reduce the use of cars?

13. Energy: Smart grids – where social and digital innovation meet

14. Healthcare: Opportunities and risks of digitization

Wrapping up: Better cities and technology

15. Two 100 city missions: India and Europe

Epilogue: Beyond the Smart City

Collect meaningful data and stay away from dataism.

I am a happy user of a Sonos sound system. Nevertheless, the helpdesk must be involved occasionally. Recently, it knew within five minutes that my problem was the result of a faulty connection cable between the modem and the amplifier. As it turned out, the helpdesk was able to remotely generate a digital image of the components of my sound system and their connections and saw that the cable in question was not transmitting any signal. A simple example of a digital twin. I was happy with it. But where is the line between the sense and nonsense of collecting masses of data?

What is a digital twin

A digital twin is a digital model of an object, product, or process. In my training as a social geographer, I had a lot to do with maps, the oldest form of ‘twinning’. Maps have laid the foundation for GIS technology, which in turn is the foundation of digital twins. Geographical information systems relate data based on geographical location and provide insight into their coherence in the form of a model. If this model is permanently connected to reality with the help of sensors, then the dynamics in the real world and those in the model correspond and we speak of a ‘digital twin’. Such a dynamic model can be used for simulation purposes, monitoring and maintenance of machines, processes, buildings, but also for much larger-scale entities, for example the electricity grid.

From data to insight

Every scientist knows that data is indispensable, but also that there is a long way to go before data leads to knowledge and insight. That road starts even before data is collected. The first step is assumptions about the essence of reality and thus the possibility of knowing it. There has been a lot of discussion about this within the philosophy of science, from which two points of view have been briefly crystallized, a systems approach and a complexity approach.

The systems approach assumes that reality consists of a stable series of actions and reactions in which law-like connections can be sought. Today, almost everyone assumes that this only applies to physical and biological phenomena. Yet there is also talk of social systems. This is not a question of law-like relationships, but of generalizing assumptions about human behavior at a high level of aggregation. The homo economicus is a good example. Based on such assumptions, conclusions can be drawn about how behavior can be influenced.

The complexity approach sees (social) reality as the result of a complex adaptive process that arises from countless interactions, which – when it comes to human actions – are fed by diverse motives. In that case it will be much more difficult to make generic statements at a high level of aggregation and interventions will have a less predictable result.

Traffic models

Traffic policy is a good example to illustrate the distinction between a process and a complexity approach. Simulation using a digital twin in Chattanooga of the use of flexible lane assignment and traffic light phasing showed that congestion could be reduced by 30%. Had this experiment been carried out, the result would probably have been very different. Traffic experts note time and again that every newly opened road becomes full after a short time, while the traffic picture on other roads hardly changes. In econometrics this phenomenon is called induced demand. In a study of urban traffic patterns between 1983 and 2003, economists Gilles Duranton and Matthew Turner found that car use increases proportionally with the growth of road capacity. The cause only becomes visible to those who use a complexity approach: Every road user reacts differently to the opening or closing of a road. That reaction can be to move the ride to another time, to use a different road, to ride with someone else, to use public transport or to cancel the ride.

Carlos Gershenson, a Mexican computer specialist, has examined traffic behavior from a complexity approach and he concludes that self-regulation is the best way to tackle congestion and to maximize the capacity of roads. If the simulated traffic changes in Chattanooga had taken place in the real world, thousands of travelers would have changed their driving behavior in a short time. They had started trying out the smart highway, and due to induced demand, congestion there would increase to old levels in no time. Someone who wants to make the effect of traffic measures visible with a digital twin should feed it with results of research into the induced demand effect, instead of just manipulating historical traffic data.

The value of digital twins

Digital twins prove their worth when simulating physical systems, i.e. processes with a parametric progression. This concerns, for example, the operation of a machine, or in an urban context, the relationship between the amount of UV light, the temperature, the wind (speed) and the number of trees per unit area. In Singapore, for example, digital twins are being used to investigate how heat islands arise in the city and how their effect can be reduced. Schiphol Airporthas a digital twin that shows all moving parts at the airport, such as roller conveyors and stairs. This enables technicians to get to work immediately in the event of a malfunction. It is impossible to say in advance whether the costs of building such a model outweigh the benefits. Digital twins often develop from small to large, driven by proven needs.

Boston also developed a digital twin of part of the city in 2017, with technical support from Esri. A limited number of processes have been merged into a virtual 3D model. One is the shadowing caused by the height of buildings. One of the much-loved green spaces in the city is the Boston Common. For decades, it has been possible to limit the development of high-rise buildings along the edges of the park and thus to limit shade. Time and again, project developers came up with new proposals for high-rise buildings. With the digital twin, the effect of the shadowing of these buildings can be simulated in different weather conditions and in different seasons (see title image). The digital twin can be consulted online, so that everyone can view these and other effects of urban planning interventions at home.

Questions in advance

Three questions precede the construction of a digital twin. In the first place, what the user wants to achieve with it, then which processes will be involved and thirdly, which knowledge is available of these processes and their impact. Chris Andrews, an urban planner working on the ESRI ArcGIS platform, emphasizes the need to limit the number of elements in a digital twin and to pre-calculate the relationship between them: To help limit complexity, the number of systems modeled in a digital twin should likely be focused on the problems the twin will be used to solve.

Both the example of traffic forecasts in Chattanooga, the formation of heat islands in Singapore and the shadowing of the Boston Common show that raw data is insufficient to feed a digital twin. Instead, data are used that are the result of scientific research, after the researcher has decided whether a systems approach or a complexity approach is appropriate. In the words of Nigel Jacob, former Chief Technology Officer in Boston: For many years now, we’ve been talking about the need to become data-driven… But there’s a step beyond that. We need to make the transition to being science-driven in …… It’s not enough to be data mining to look for patterns. We need to understand root causes of issues and develop policies to address these issues.

Digital twins are valuable tools. But if they are fed with raw data, they provide at best insight into statistical connections and every scientist knows how dangerous it is to draw conclusions from that: Trash in, trash out.