Urban design for complexity 

Throughout history, cities have faced many problems: War and violence, disease, disasters, housing, utilities, traffic, crime, inequality, poverty, and greed. Moreover, the pace of population growth in cities is frightening. Every day, urban population increases by almost 150,000 – mostly poor – people, due to migration or births. Between to date and 2050, the world’s urban population is projected to rise from 3.6 billion to 6.3 billion residents.

The litany of problems affects all cities in the world, but not in the same degree. To cope with these problems, each city must make a diagnose of its own challenges and define solutions. 

City-life is complex and most afore-mentioned problems are related and often at odds, think about struggling poverty and reversing global heating. Therefore, these problems cannot be solved in separated silos. This is the reason reason that I reject reductionist approaches like ‘smart city’, ‘sharing city’, ‘circular city’ and the like. 

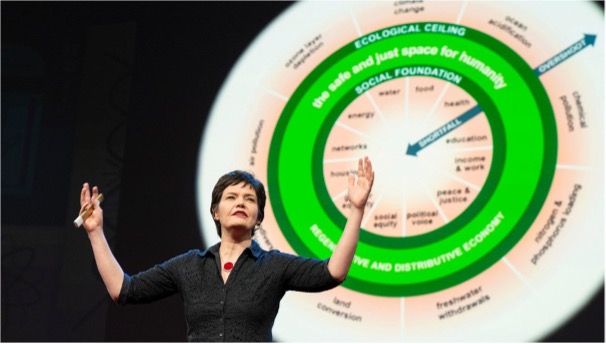
Instead, framing the challenges that cities face must start from the complexity of the city as such and the interrelations of people causing these problems. In this respect, I found the concept of a doughnut economy particularly helpful. It is elaborated by the British economist Kate Raworth in a report entitled A Safe and Just Space for Humanity. The report takes the simultaneous application of social and environmental sustainability as the point of department for humane behavior.

In essence, Raworth says that people have a great deal of freedom in the choice of activities in their city, if they stay within two types of boundaries:

The first limit is set by ecosystems; which make life on earth possible. However, we can also frustrate their operation, which has a direct impact on our living conditions. 

Something similar applies to society. Here you can also distinguish several aspects and each of them has a level that people should not fall below, the second limit. If this does happen, it will jeopardize the survival of society.

If you look at a donut, you will see a small circle in the center and a large circle on the outside. The small circle represents the social foundation, the lower limit of the quality of society. The large circle refers to the ecological ceiling. Between the two circles lies the space within which people can act as they please. Kate Raworth calls this space a safe and just space for humanity.

On the way to a city for humanity , what we need to do is, first of all, to define human actions that comply with or are threatening the ecological ceiling and social foundation of our own city. What follows is the formulation of targets to correct and subsequently enforce all actual violations of ecological and social boundaries. This applies to the city itself and the global effects of its activities.

As an exercise, I created a table of principles for 10 clusters of activities to address the challenges that many cities in developed countries share, combined with one target for each principle. You may want to download this table here.

I recommend this procedure to any city that intends to develop an integral vision starting from the complexity of city life and the interdependency of its activities. Amsterdam went through this process, together with Kate Raworth. The Amsterdam city donut is worth exploring closely.

This post based on by the new e-book Better cities, the contribution of digital technology.  Interested? Download the book here for free (90 pages)

Content:

Hardcore: Technology-centered approaches

1. Ten years of smart city technology marketing

2. Scare off the monster behind the curtain: Big Tech’s monopoly

Towards a humancentric approach

3. A smart city, this is how you do it

4. Digital social innovation: For the social good

Misunderstanding the use of data

5. Digital twins

6. Artificial intelligence

Embedding digitization in urban policy

7. The steps to urban governance

8. Guidelines for a responsible digitization policy

9. A closer look at the digitization agenda of Amsterdam

10. Forging beneficial cooperation with technology companies

Applications

11. Government: How digital tools help residents regaining power?

12. Mobility: Will MaaS reduce the use of cars?

13. Energy: Smart grids – where social and digital innovation meet

14. Healthcare: Opportunities and risks of digitization

Wrapping up: Better cities and technology

15. Two 100 city missions: India and Europe

Epilogue: Beyond the Smart City

Collect meaningful data and stay away from dataism.

I am a happy user of a Sonos sound system. Nevertheless, the helpdesk must be involved occasionally. Recently, it knew within five minutes that my problem was the result of a faulty connection cable between the modem and the amplifier. As it turned out, the helpdesk was able to remotely generate a digital image of the components of my sound system and their connections and saw that the cable in question was not transmitting any signal. A simple example of a digital twin. I was happy with it. But where is the line between the sense and nonsense of collecting masses of data?

What is a digital twin

A digital twin is a digital model of an object, product, or process. In my training as a social geographer, I had a lot to do with maps, the oldest form of ‘twinning’. Maps have laid the foundation for GIS technology, which in turn is the foundation of digital twins. Geographical information systems relate data based on geographical location and provide insight into their coherence in the form of a model. If this model is permanently connected to reality with the help of sensors, then the dynamics in the real world and those in the model correspond and we speak of a ‘digital twin’. Such a dynamic model can be used for simulation purposes, monitoring and maintenance of machines, processes, buildings, but also for much larger-scale entities, for example the electricity grid.

From data to insight

Every scientist knows that data is indispensable, but also that there is a long way to go before data leads to knowledge and insight. That road starts even before data is collected. The first step is assumptions about the essence of reality and thus the possibility of knowing it. There has been a lot of discussion about this within the philosophy of science, from which two points of view have been briefly crystallized, a systems approach and a complexity approach.

The systems approach assumes that reality consists of a stable series of actions and reactions in which law-like connections can be sought. Today, almost everyone assumes that this only applies to physical and biological phenomena. Yet there is also talk of social systems. This is not a question of law-like relationships, but of generalizing assumptions about human behavior at a high level of aggregation. The homo economicus is a good example. Based on such assumptions, conclusions can be drawn about how behavior can be influenced.

The complexity approach sees (social) reality as the result of a complex adaptive process that arises from countless interactions, which – when it comes to human actions – are fed by diverse motives. In that case it will be much more difficult to make generic statements at a high level of aggregation and interventions will have a less predictable result.

Traffic models

Traffic policy is a good example to illustrate the distinction between a process and a complexity approach. Simulation using a digital twin in Chattanooga of the use of flexible lane assignment and traffic light phasing showed that congestion could be reduced by 30%. Had this experiment been carried out, the result would probably have been very different. Traffic experts note time and again that every newly opened road becomes full after a short time, while the traffic picture on other roads hardly changes. In econometrics this phenomenon is called induced demand. In a study of urban traffic patterns between 1983 and 2003, economists Gilles Duranton and Matthew Turner found that car use increases proportionally with the growth of road capacity. The cause only becomes visible to those who use a complexity approach: Every road user reacts differently to the opening or closing of a road. That reaction can be to move the ride to another time, to use a different road, to ride with someone else, to use public transport or to cancel the ride.

Carlos Gershenson, a Mexican computer specialist, has examined traffic behavior from a complexity approach and he concludes that self-regulation is the best way to tackle congestion and to maximize the capacity of roads. If the simulated traffic changes in Chattanooga had taken place in the real world, thousands of travelers would have changed their driving behavior in a short time. They had started trying out the smart highway, and due to induced demand, congestion there would increase to old levels in no time. Someone who wants to make the effect of traffic measures visible with a digital twin should feed it with results of research into the induced demand effect, instead of just manipulating historical traffic data.

The value of digital twins

Digital twins prove their worth when simulating physical systems, i.e. processes with a parametric progression. This concerns, for example, the operation of a machine, or in an urban context, the relationship between the amount of UV light, the temperature, the wind (speed) and the number of trees per unit area. In Singapore, for example, digital twins are being used to investigate how heat islands arise in the city and how their effect can be reduced. Schiphol Airporthas a digital twin that shows all moving parts at the airport, such as roller conveyors and stairs. This enables technicians to get to work immediately in the event of a malfunction. It is impossible to say in advance whether the costs of building such a model outweigh the benefits. Digital twins often develop from small to large, driven by proven needs.

Boston also developed a digital twin of part of the city in 2017, with technical support from Esri. A limited number of processes have been merged into a virtual 3D model. One is the shadowing caused by the height of buildings. One of the much-loved green spaces in the city is the Boston Common. For decades, it has been possible to limit the development of high-rise buildings along the edges of the park and thus to limit shade. Time and again, project developers came up with new proposals for high-rise buildings. With the digital twin, the effect of the shadowing of these buildings can be simulated in different weather conditions and in different seasons (see title image). The digital twin can be consulted online, so that everyone can view these and other effects of urban planning interventions at home.

Questions in advance

Three questions precede the construction of a digital twin. In the first place, what the user wants to achieve with it, then which processes will be involved and thirdly, which knowledge is available of these processes and their impact. Chris Andrews, an urban planner working on the ESRI ArcGIS platform, emphasizes the need to limit the number of elements in a digital twin and to pre-calculate the relationship between them: To help limit complexity, the number of systems modeled in a digital twin should likely be focused on the problems the twin will be used to solve.

Both the example of traffic forecasts in Chattanooga, the formation of heat islands in Singapore and the shadowing of the Boston Common show that raw data is insufficient to feed a digital twin. Instead, data are used that are the result of scientific research, after the researcher has decided whether a systems approach or a complexity approach is appropriate. In the words of Nigel Jacob, former Chief Technology Officer in Boston: For many years now, we’ve been talking about the need to become data-driven… But there’s a step beyond that. We need to make the transition to being science-driven in …… It’s not enough to be data mining to look for patterns. We need to understand root causes of issues and develop policies to address these issues.

Digital twins are valuable tools. But if they are fed with raw data, they provide at best insight into statistical connections and every scientist knows how dangerous it is to draw conclusions from that: Trash in, trash out.